E-2 Visa Approval Rate 2025: FY2025 Data by Country
The State Department published its FY2025 nonimmigrant visa data, and the E-2 numbers surprised most people tracking the program. Instead of the record-breaking year the industry expected, E-2 issuances came in at 51,047, down 7.8% from FY2024’s record of 55,324.
That dip has generated questions. Is the E-2 program slowing down? Should investors from certain countries be concerned about their chances? And what does an "approval rate" actually mean when applied to a visa that runs through U.S. consulates in more than 70 countries?
This article answers those questions with the full FY2016–FY2025 dataset, country-by-country breakdowns, and context that the raw numbers alone don't provide.
Note on data sourcing: All E-2 issuance figures in this article come from the U.S. State Department's Report of the Visa Office, Table XVI (Nonimmigrant Visas Issued by Classification), FY2016–FY2025. These are consular issuances, not USCIS petitions.
FY2025 E-2 Visa Numbers: The Full Picture

The headline figure is 51,047 total E-2 issuances in fiscal year 2025 (October 2024 through September 2025). That's down from 55,324 in FY2024, which was the highest single-year total since the modern program took its current form.
Two ways to read this:
- Pessimist view: The streak of growth is broken. FY2023 delivered 54,812 issuances; FY2024 pushed to 55,324; FY2025 reversed that trend.
- Realist view: FY2025 is still the third-highest year on record, 18% above FY2019's pre-pandemic baseline of 43,286, and more than double FY2020's COVID-era low of 23,493.
The program is not in decline. It's normalizing after two years of post-COVID surge demand.
Ten Years of E-2 Data: What the Trend Actually Tells Us
The decade from FY2016 to FY2025 breaks into three distinct chapters.
From FY2016 to FY2019, the program ran in a tight band: roughly 41,000 to 44,000 issuances per year. Demand was stable, processing was predictable, and Japan accounted for roughly 30% of all approvals year after year.
FY2020 shattered that pattern. Consulates went dark, travel halted, and E-2 issuances collapsed to 23,493, the lowest total in at least 15 years. The following two years were spent catching up, with FY2021 and FY2022 posting 41% and 38.5% growth respectively as consulates cleared backlogs.
FY2023 and FY2024 then produced the two biggest years the program has ever seen. FY2023 crossed 54,000 for the first time. FY2024 edged past 55,000. At those rates, a FY2025 total above 60,000 looked possible.
That didn't happen. The 7.7% drop in FY2025 is best understood as a demand correction rather than a structural problem. Processing backlogs at high-volume consulates in Tokyo, Seoul, and Paris normalized.
A portion of the post-COVID pent-up demand that had inflated FY2023 and FY2024 had been absorbed.
The ten-year average through FY2025 sits at approximately 43,600 issuances per year. FY2025's 51,047 is 17% above that average. By historical standards, this is still a strong year.

E-2 Visa Approval Rate by Country: Who's Up, Who's Down
The most useful way to look at E-2 data is by nationality. The program is tied to bilateral investment treaties; only nationals of treaty countries qualify. Volume varies enormously by country.

Japan: Still Dominant, But Slightly Declining
Japan has led E-2 issuances every year in this dataset. Its 15,367 FY2025 issuances represent 30.1% of the entire program. Japan’s bilateral investment treaty with the United States has been in place since 1953.
Still, Japan's share has edged down from around 31–33% in earlier years. The program is gradually diversifying.
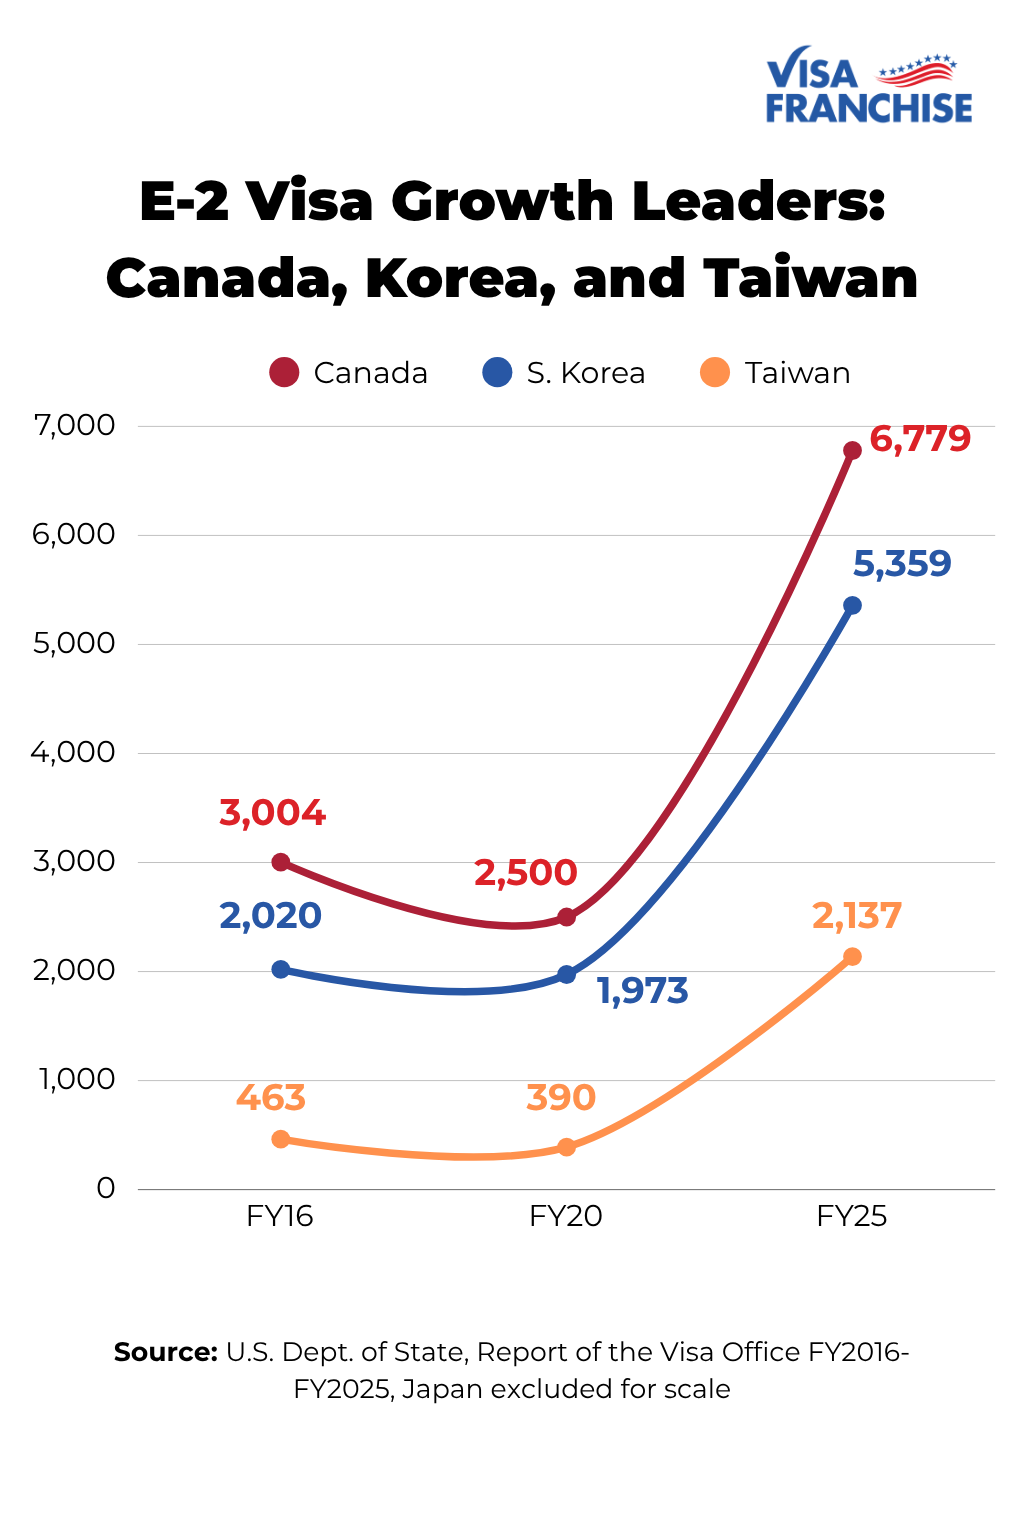
Canada and South Korea: The Decade's Biggest Stories
Canada grew from 3,004 issuances (FY2016) to 6,779 (FY2025). Much of this growth traces to franchise-based E-2 investment, particularly in service sector businesses in major U.S. metros.
Canadian applicants also benefit from applying at the U.S. consulate in their home country rather than navigating USCIS change-of-status processing.
South Korea's 165% increase over the decade is driven by a similar pattern: franchise investment, a strong Korean-American business community, and a bilateral treaty that has been fully operational for decades. South Korean applicants now account for over 10% of all E-2 issuances, up from about 4.6% in FY2016.
Taiwan: The Biggest Surge Few Are Talking About
In FY2016, just 463 Taiwanese nationals received E-2 visas. By FY2025, that figure was 2,137, a 362% increase.
This growth accelerated sharply from FY2022 onward, coinciding with increased Taiwanese business investment in the United States, particularly in manufacturing and technology-adjacent sectors.
Germany, UK, Mexico, Italy: Declining Volumes
Germany, the UK, Mexico, and Italy all show meaningful volume declines compared to their FY2016 baselines. Germany dropped from 4,329 to 3,271 (-24%).
The UK fell from 2,969 to 2,140 (-28%).
Mexico declined from 2,621 to 1,739 (-34%), partly due to processing complications and a shift toward L-1 and EB-5 pathways for some applicants. Italy went from 2,054 to 1,241 (-40%).
These declines don’t reflect unfavorable approval rates at consulates. They track changing investor behavior and the shifting attractiveness of different visa pathways.

What Does "E-2 Visa Approval Rate" Actually Mean?
This is worth clarifying, because "approval rate" is used loosely in most E-2 discussions and it can mislead prospective applicants.
The State Department’s data (including all figures cited in this article) tracks consular issuances. These are cases where a consular officer at a U.S. embassy or consulate reviewed an application and issued the visa.
This is the most common pathway: apply outside the U.S., attend an interview, receive your visa.
There is a second pathway: change of status through USCIS if you're already in the United States on another visa. USCIS processes the petition and approves (or denies) it without involving a consulate. Those approvals are not captured in the State Department issuance data.
So when people ask "what is the E-2 approval rate," the honest answer depends on which process you're in:
- Consular issuance: The State Department doesn't publish a blanket approval/denial ratio, but well-prepared applicants with qualified investments and strong business plans are approved at very high rates at most consulates.
- USCIS COS petition: USCIS does publish approval rates by visa class. E-2 approvals have historically run above 90% across the program. With experienced legal counsel and a qualifying investment, approval rates are considerably higher.
- Visa Franchise clients: Visa Franchise reports a final approval rate above 95% across its client portfolio, based on selecting only investments that pass its due diligence process (less than 2% of evaluated opportunities) and thorough business plan preparation.
What This Data Means If You're Planning to Apply
The FY2025 data presents a clear picture for investors evaluating the E-2 pathway.
Demand for the program remains high by any historical measure. The 7.7% dip from FY2024's record does not change the underlying trend: E-2 issuances have grown roughly 18% over the pre-COVID baseline and the program has continued expanding since the pandemic. Consulates are processing applications, and approval rates for well-structured cases remain strong.
Country matters for planning. Canadian and South Korean investors are applying in record numbers, which means consulates handling those nationalities are experienced and efficient.
Japanese investors continue to dominate the program. If you’re from a country showing declining volume (Germany, UK, Mexico), that likely reflects investor behavior shifts, not processing problems.
The investment quality is more important than the investment amount. The minimum investment threshold for E-2 isn't fixed by statute; it varies by business type and is evaluated on a case-by-case basis. A $150,000 franchise investment in a proven system with a strong business plan will outperform a $500,000 investment in an untested concept with weak documentation.
Franchise-based investments performed consistently well in Visa Franchise’s client portfolio. The due diligence process evaluates established business systems with documented revenue projections, staffing requirements, and market data, information that doesn’t exist for untested concepts.
Ready to Start Your E-2 Visa Process?
We have guided 1,250+ families through the E-2 process since 2015, with a final approval rate above 95%. We evaluate hundreds of franchise opportunities each year; fewer than 2% qualify for its E-2 investment network.
To understand which investment and pathway fits your situation, complete our eligibility form and schedule a discovery call with our team!
Frequently Asked Questions
What is the current E-2 visa approval rate?
The State Department does not publish a single "approval rate" for the E-2 program. What is publicly available is issuance data: 51,047 E-2 visas were issued in FY2025.
Among represented applicants working with experienced immigration counsel, approval rates consistently run above 90%. Visa Franchise's client approval rate exceeds 95%, reflecting the firm's selective investment evaluation process.
Which country has the highest E-2 visa approval rate?
Japan accounts for the largest share of E-2 issuances: 15,367 in FY2025, or 30.1% of the program. Canada (6,779) and South Korea (5,359) hold second and third place.
Taiwan has grown the most dramatically over the past decade, up 362% from FY2016. Eligibility depends on treaty status, not nationality-specific approval rates, which the State Department does not break out.
How many E-2 visas are issued each year?
FY2025: 51,047. FY2024 (the record): 55,324. FY2023: 54,812. The ten-year average (FY2016–FY2025) is approximately 43,600 per year.
The program saw a sharp COVID-era dip to 23,493 in FY2020 and has been well above pre-pandemic levels since FY2022.
Did E-2 visa approvals decrease in 2025?
Yes. E-2 issuances fell 7.7% in FY2025, from FY2024's record of 55,324 to 51,047. The decline appears to be a normalization following two consecutive post-COVID surge years, rather than a structural change to the program. FY2025 issuances remain 18% above the FY2019 pre-pandemic baseline.
How long does E-2 visa processing take in 2025?
Consular processing (applying at a U.S. embassy abroad) typically takes 2–8 weeks from application to visa issuance for well-prepared cases.
USCIS change of status processing runs 3–6 months on the regular track. Premium processing (available for USCIS filings, currently $2,805 additional) guarantees a decision within 15 business days.
Why do some E-2 visa applications get denied?
The most common denial reasons are: the investment is passive or not "at risk" (funds already in a bank account, not actively deployed into the business); the investment amount is insufficient to capitalize the business; the applicant cannot demonstrate intent to "develop and direct" the enterprise; or the business plan doesn't meet documentary standards.
These issues are addressable with proper preparation before filing.
Will E-2 visa approvals recover in 2026?
Every previous decline in the dataset was followed by recovery: FY2018’s dip reversed in FY2019; FY2020’s collapse returned to pre-pandemic levels by FY2022. FY2025 sits 18% above the FY2019 baseline.
Whether FY2026 surpasses FY2024’s 55,324 record depends on consulate processing capacity and macroeconomic conditions.
Discover if you qualify to invest in a thriving U.S. franchise and secure your E-2 visa.
Check your eligibility
More Insights You Might Like
Explore related articles packed with expert advice, real stories, and practical tips to support your U.S. visa and relocation journey.